Cell metabolism exploration services
OUR UNIQUE CELL METABOLISM EXPLORATION SERVICES
A high throughput high precision fee for service platform dedicated to cell metabolism exploration
Our platform offers you our abilities to carry out high quality functional metabolism exploration analyses on your preferred biological model (cell, animal, …). It uses high throughput, muti-parametric, non-radioactive, quantitative readouts technology.
A starting test portfolio dedicated to several cell central metabolisms
Oxidative Stress
Enzymatic activities
Cu/Zn Superoxide dismutase (SOD1)
Mn Superoxide dismutase (SOD2)
Catalase (CAT)
Glutathione peroxidase (GPX)
Glutathione reductase (GR)
Glucose 6P dehydrogenase (G6PD)
Glutathione synthase (GSS)
Glutamylcysteinyl synthase (GCLC)
Substrates
Total Glutathione (TG)
Reduced Glutathione (GSH)
Oxidized Glutathione (GSSG)
Malondialdehyde (MDA)
Oxidized LDL (oxLDL)
8-Isoprostane (8-iso-PGF2α)
8-oxo-2′-deoxyguanosine (8-oxo-dG)
Global Antioxidant Tests
DPPH
FRAP
Mitochondrial function
Enzymatic activities
Citrate Synthase (CS)
ETC Complex I (CI)
ETC Complex II (CII)
ETC Complex III (CIII)
ETC Complex IV (CIV)
ATP synthetase Complex V (CV)
Substrates
ATP
ADP
AMP
TAN
Central metabolism
Enzymatic activities
Hexokinase (HK)
Fructose 1,6-diP aldolase (ALDO)
Glyceraldehyde 3-P dehydrogenase (GAPDH)
Pyruvate kinase (PK)
Lactate dehydrogenase (LDH)
Aspartate aminotransferase (ASAT)
Alanine aminotransferase (ALAT)
Gamma-glutamyl peptidase (γGT)
Alkaline phosphatase (ALP)
Glutamate dehydrogenase (GLDH)
Creatine kinase (CK)
Substrates
Lactate
Pyruvate
Malate
Glucose
Acetate
Acetoacetate
Beta-Hydroxybutyrate
Non esterified fatty acids
Triglycerides
Glycerol
Cholesterol
Cell inflammation
IL1α,β
IL2
IL4
IL6
IL8
IL10
IL17
IL21
IFNγ
TNFα
RANTES
MCP1 (CCL2)
MIP1α (CCL3)
PAI-1
CRP
sCD40L
Energy regulation
Insulin
Glucagon
Adiponectin
Leptin
Resistin
Miscellaneous cell markers
Cytokeratin 18 (KRT18)
Creatinine
Cystatin C (CST3)
Lipocalin (NGAL)
Albumin
Bilirubin
Homocysteine
Carnitine
Cell-free DNA (CFDNA)
A minimal sample size for a whole test
Our platform needs to work only very few starting material. For example, 19 metabolic variables can be measured on as few as:
- 3-5 million cells (cell culture, highly dependent on cell type)
- 5 mL whole blood
- 5-10 mg of tissue/biopsies
A standardized method for all samples (see specimen collection procedures)
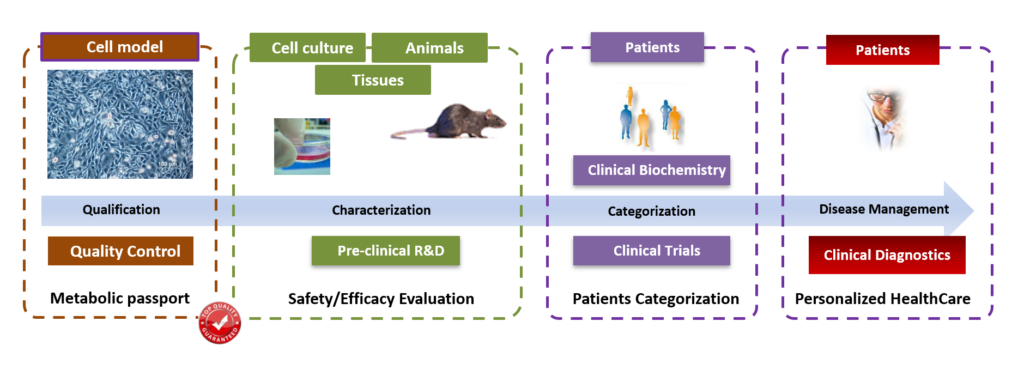
As there is no species restriction, IntegraCell platform can be used on a wide variety of sample types all along any drug life cycle… from cell characterization to patient categorization.
A unique, comprehensive approach
Our metabolism exploration platform enables a comprehensive assessment of the whole enzymatic cascade, currently the only way to allow a relevant interpretation.
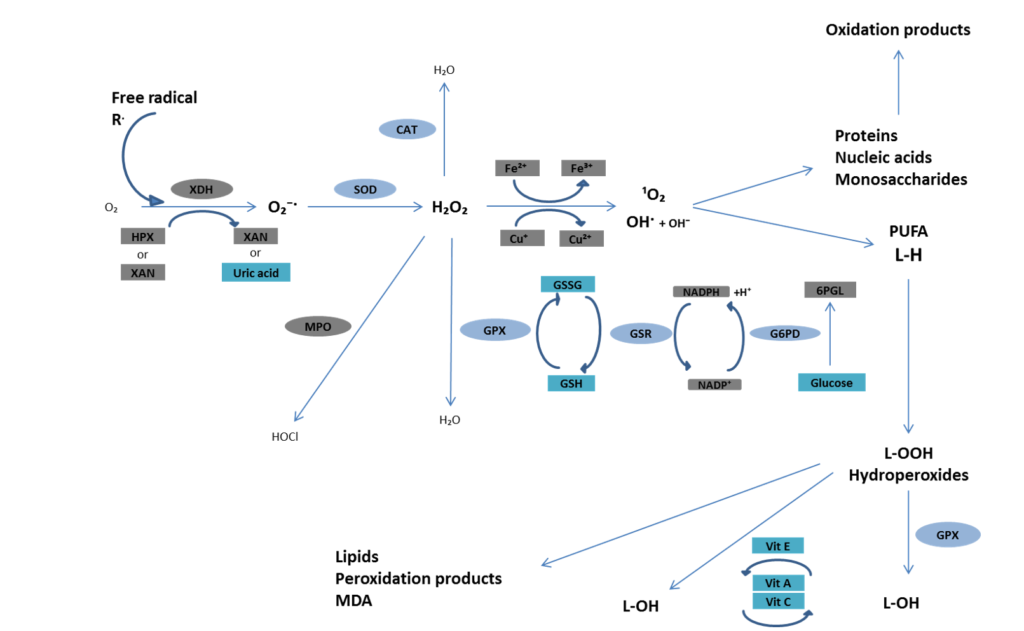
In any oxidative stress (OS), a strong oxidizing agent, the superoxide anion, is produced. This highly toxic entity must absolutely be detoxified. The superoxide dismutase (SOD) will reduce it thus detoxify. An increase in SOD activity therefore seems to be beneficial. However, the story is more complex. Indeed, superoxide anion is transformed by SOD into hydrogen peroxide, an even more oxidizing entity than superoxide anion that will be even more toxic. Thus, increasing SOD activity would not be as positive as it should be as it can induce by itself a toxic effect.
At this stage, with a unique SOD activity quantification, no clear conclusions can be raised. Is SOD elevation a good or an adverse effect? To answer that question, a deeper metabolic analysis must be performed. SOD activity measurement alone cannot be informative. Thus, it is absolutely mandatory to combine activity measurement of the two enzymes able to reduce hydrogen peroxide to a non-toxic molecule, water, namely glutathione peroxidase (GPX) and catalase (CAT).
Let’s come back to our example again. The superoxide anions generated during OS have been transformed into hydrogen peroxide, which now must absolutely be eliminated. Two possibilities then arise:
- Both CAT and GPX activities also increase and are sufficient to detoxify all produced hydrogen peroxide. OS is now correctly under control.
- CAT and GPX activities do not increase in parallel. They are not sufficient to correctly detoxify hydrogen peroxide. The oxidizing agents play their toxic role, there is OS that is not under control.
At that time only, it becomes possible to say whether SOD activity increase is a positive or negative issue. It becomes also possible to tell if there has been a radical attack and if there has been a cellular reactivity.
As we can measure the activities of both SOD 1 and 2 (respectively, essentially cytosolic and mitochondrial), then GPX and CAT, we can tell whether the attack is rather cytosolic, or mitochondrial, or both, and whether the level of cellular reactivity is adapted in both compartments. Such informations are interesting, but still not sufficient to assume whether OS will be able to continue or not. Indeed, we still do not know if cellular reactivity will be sufficient to stop OS or not.
At this stage, it is tempting to draw an analogy between the cell and a besieged citadel. The enemy, here the free radicals generated by the induced stress, is around the citadel and attack it relentlessly. We see that we could tell whether the defenders of the citadel were in sufficient number and whether they were fighting valiantly. But, regardless of their bravery, will they be able to defeat the besiegers?
It does not lean strictly on them, but on the state of the citadel’s reserve stocks of weapons and ammunitions. To get a clear idea, it is therefore necessary to explore these reserves, particularly in terms of means of defense, but also to evaluate the capacity the citadel may have to restore them.

In our example, the first of these means of defense is reduced glutathione (GSH). But, here again, a simple dosage will not be sufficient. Measurement of total glutathione, used solely, or that of GSH, used solely, makes no sense because it is not informative of what is actually happening. It is much more interesting to determine both concentrations of oxidized glutathione (GSSG) and GSH. In fact, when cell used GSH as an antioxidant, GSH is transformed on demand into GSSG, so it becomes essential to know the respective concentrations of the two glutathione forms. These two concentrations will allow us to perform two calculations that will help us in our understanding , the ratio GSSG/GSH and total glutathione (GSH+2*GSSG).
A high ratio indicates an increase of the oxidized form. This can be the resultant of two causes:
- A high use of glutathione
- A lack of efficiency of glutathione reduction systems.
A Low total glutathione can be related to :
- An hyperconsumption of glutathione, faster than its synthesis.
- An insufficient glutathione synthesis.
Several scenarii can arise:
1/ If we observed a normal ratio, we will have to look after total glutathione (TG)
- If TG is normal, no problem, cell defences are still sufficient.
- If TG is lowered, both GSH and GSSG are lowered, but the reduced/oxidized ratio remains correct. So, a priori, there is no defect in the capacity to reduce the formed GSSG. Nevertheless, the low TG signs either
- a defect in glutathione synthesis, it will be necessary to analyze the activity of glutathione synthases, or
- an hyperconsumption linked to a major radical attack or the activation of another metabolic pathway expending glutathione.
In these different occurences, it will be necessary to analyze peroxidation markers that will allow to conclude.
2/ If we observed an abnormal ratio and a normal total glutathione, glutathione reduction system has to be analyzed: both glutathione reductase (GR) and glucose 6 phosphate dehydrogenase (G6PD) activities must be measured.
- GR activity is normal. The enzyme may lack its substrate NADPH to effectively reduce GSSG. We look at the G6PD activity.
– G6PD activity is normal. The GSSG reduction system is operational, but NADPH is consumed in another metabolism.
– G6PD activity is abnormal. The production of NADPH is insufficient, the reduction system is failing.
- Glutathione reductase activity is abnormal: The reduction system is defective.
Relevant metabolic inferences can be made based on each combination of these parameters, whether their activities or concentrations are decreasing or increasing.
So we can see that with our extended panel we can know :
– if the citadel is violently attacked or not,
– if there are enough defenders or not,
– whether they are defending themselves valiantly or not,
– whether they have sufficient ammunition at their disposal or not,
– whether they have the capacity to make new ones or not.
It is therefore possible to conclude, for example, that the cell undergoes a major attack, that it correctly stimulates its available means of defense, but that it will not be possible to resist for a long time because its means of regeneration are insufficient. In such a case, cell situation is not fair, as even if it still resists, it will not be be for long. In that case, peroxidation markers will be very moderately increased. This weak increase can potentially lead to believe, if analysis relies on this sole marker, that peroxidation is low or even non-existent whereas true picture is strictly the opposite as peroxidation is exceeding cell’s defense capabilities.
If cells would be harvested a few hours later, the picture would have been totally different with a collapse of the defense systems and peroxidation markers being very high at that time.
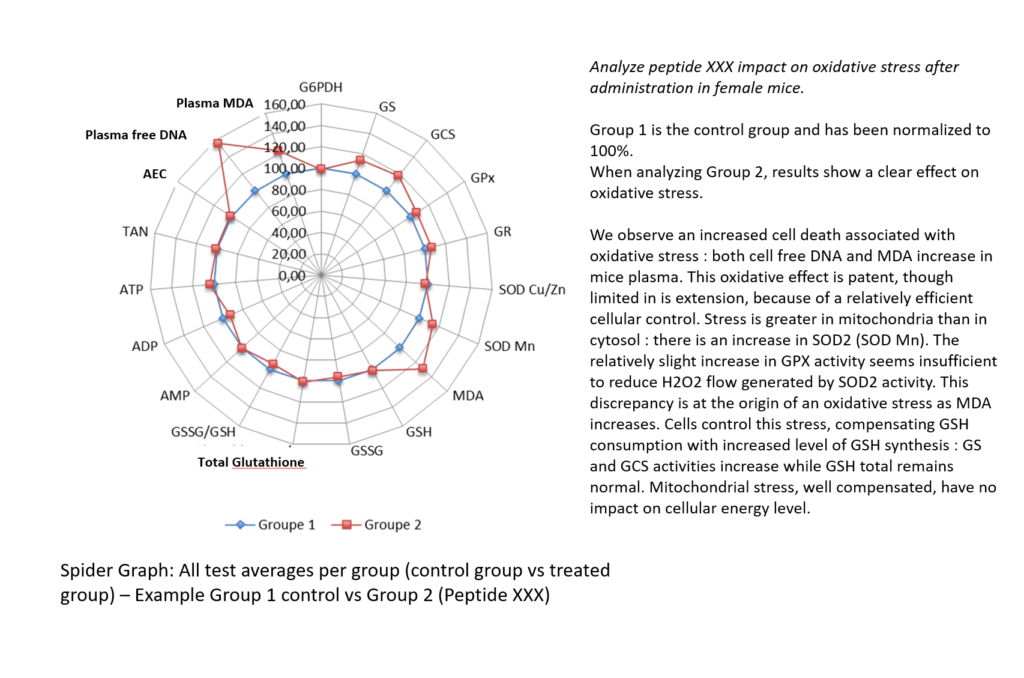
With such kind of analysis, we can have a deep look at the oxidative status. We can observe if a molecule allows a better preservation of cell defenses than another and thus establish a pertinent classification of protection levels of each of the tested products.
Such integrative explanation can only be performed because our platform launches all analyzes simultaneously avoiding any specimen material degradation and generates highly accurate results for every parameter. Precision and simultaneity are the keys of best quality in metabolism exploration.
OUR UNIQUE EXPERTISE ON METABOLISM EXPLORATION
We have launch INTEGRACELL to bring you our capacities to carry out high quality functional metabolism exploration analyses on your privileged biological model. But with our services, our study results include not only raw data but also supportive information assisting your understanding of observed metabolic changes. Indeed, once we analyzed the data in an anonymous way, and sent the results to you, we will communicate with you about the values we observed. Then, once the anonymity is removed, we recontact you to exchange on a first interpretation, according to other data you would like to communicate to us.
As our team is composed of experienced researchers, we can also help you go deeper into the interpretation of your results with a special contract services that includes scientific discussions based on a deep and comprehensive bibliography.
For the same reasons, we can also advise you on the realization of your experimental designs.
Beyond the services offered in our specific catalog, we are associated with other industrial and academic partners, which allow us to offer you also other complementary analyses. Do not hesitate to contact us, so that we can define with you the most appropriate analyses or panel to answer your question(s).
OUR METABOLISM EXPLORATION FLOW CHART
We do not have our own cellular or animal models. We prefer that our clients use the same models that they are used to and for which they already have a whole history of data.
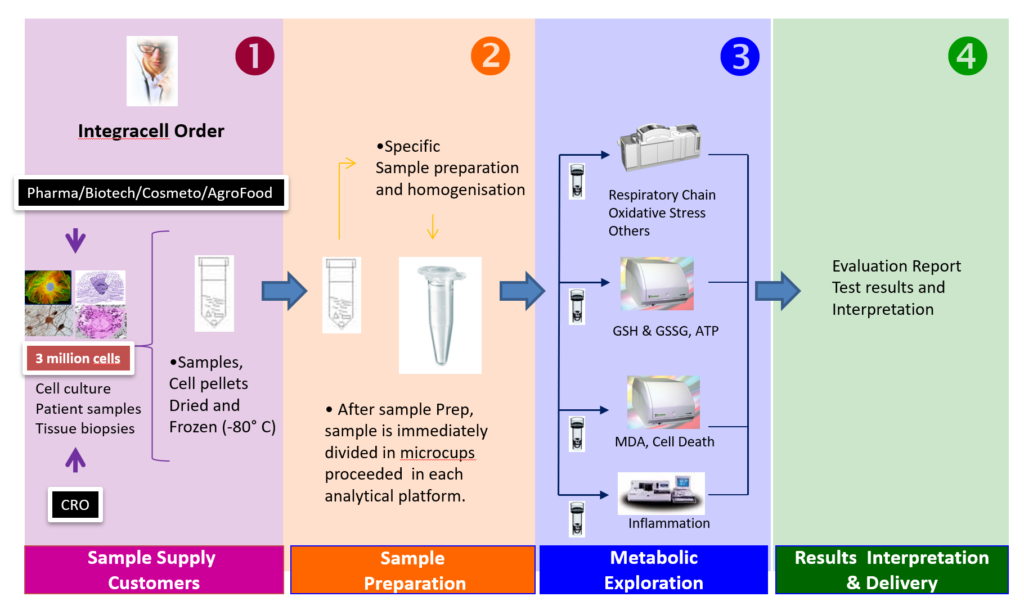
We receive from our customers, CRO or industries, frozen samples: scraped cells, dry cell pellets; tissue biopsies; explants; blood samples; etc… (for more information, see our specimen collection procedure)
The transport must be performed on dry ice. You will receive a confirmation e-mail as soon as the samples have arrived in our laboratory.
The samples are sent anonymized, (if they are not, we will anonymize them for processing).
Except in special cases, we send you, after two weeks, an Excel sheet with the raw results, informing you of particular points that may concern technical aspect of certain results. You then can lift anonymity, and if you wish, give us some informations about the different groups, at least providing us the group you consider to be the control group.
We reclassify the data and bring the groups together. We will then inform you of any results that we consider to be outliers or at least curious. After taking a few days to think about the results, we organize a results meeting where we will give you our interpretation of the observed results. This meeting usually lasts one hour.
If we agree, we send you a draft report.
We can still have some exchanges by e-mail about it. Then, as a rule, you will receive the final report about 4 weeks after samples receipt.